


The OS-B is built using data from 2,558 dental practices across the United States who used the Overjet, Inc. Practice Application11 and includes data from 321,530 adult patients who were 21 years of age or older (Figure 1). All patient data were deidentified in accordance with HIPAA guidelines to ensure confidentiality. These practices are located in every U.S. state as well as Puerto Rico.

Geographic distribution of the 2558 dental practices whose data were used to develop the OS-B.
The development of the OS-B included defining the clinical components of the score, developing a test dataset and subsets, and developing a novel treatment probability weighted cost-function to calculate a weighted individual tooth score from each of the patient’s 28 permanent teeth, excluding third molars. The adult human dentition typically includes up to 32 teeth, including four third molars (wisdom teeth). Contemporary dental public health research increasingly adopts 28-tooth frameworks for population-level studies. This methodology uses the 28 tooth framework in order to determine a more consistent and comparable metric across diverse demographic groups, minimizing confounding variables associated with third molar variability. We acknowledge that third-molars can impact overall health, particularly in the context of periodontal disease, and future research should further explore the use of the 32- vs. the 28-tooth framework in the score calculation. For the purposes of this study, individual tooth scores for the patient’s 28 permanent teeth were then averaged into a mouth-level summary score called OS-B. Once constructed, we conducted a preliminary validation of OS-B on the test dataset and compared the OS-B to the Marcus et. al OHSI3.
The clinical condition of the 28 permanent teeth was assessed using findings from the Overjet AI platform and its proprietary, FDA-cleared Machine Learning Algorithms (MLA) along with periodontal probing depth data from patient electronic records. Overjet’s AI models for detecting and segmenting caries, calculus, periapical radiolucencies (PARL), margin discrepancies, and existing restorations—including fillings, crowns, root canal-treated (RCT) teeth, and implants—are all based on a proprietary Convolutional Neural Network architecture designed to perform object detection and segmentation on dental radiographs. The architecture includes a CNN backbone based on ResNet with Feature Pyramid Network (FPN) for feature extraction, a Region Proposal Network (RPN) to generate candidate object regions, and a final stage that predicts bounding box locations, instance masks, and keypoints as needed. Table 2 presents the standalone sensitivity and specificity of each model used in this research.
Overjet’s algorithms detect and segment clinical conditions on bitewing and periapical radiographs, and Figs. 2 and 3 provide examples of how these clinical findings are noted on dental radiographs.

This figure illustrates the clinical findings on dental radiographs as they appear in their original state and as analyzed by the Overjet AI platform. Images (A) and (C) are the original radiographs; images (B) and (D) are analyzed radiographs by the Overjet AI platform. Image B has segmentations in white to represent enamel, purple for pulp, blue for restorations including implant restorations, red for caries, marginal discrepancies in yellow box, calculus in an orange box, and millimeter bone level measurements in green, yellow and red corresponding to the value measured. Tooth numbers are presented in pink. Image (D). In addition to identifying caries and measuring bone levels, this radiograph includes a PARL, indicated as a yellow-green crescent shape at the apex area of tooth number 10.

Top ROW: The teeth images (A) and (B) are used to illustrate 2-dimensional segmentations similar to the radiographs (C) and (D). From the top left, in image (A) illustrates the location of the CEJ on the tooth. The portion of the tooth identified as above or coronal to the dotted line is defined as the coronal portion of the tooth, and the area of the tooth below or apical to the CEJ is considered the root portion of the tooth. Image (B) depicts in 2 dimensions how the tooth is segmented to calculate DMFP by identifying the coronal portion of the tooth that is decayed (red), missing (orange), and filled (green). Image (C) shows a standard periapical radiograph without AI generated predictions. Image (D) shows the AI-analyzed image illustrating the decayed, missing and filled segmentations on this radiograph. The DMFP calculation for tooth number 30 is 0.71. Bottom Row: Image (E) illustrates the anatomical landmarks that are used to measure the interproximal alveolar bone level: CEJ and crest of bone. The distance between these two points is the reported bone level (BL). This measurement is analyzed on the mesial and distal of each tooth on the radiograph and can be seen on the bone level image (F).
The dental conditions analyzed by the Overjet AI platform include:
-
(1)
Tooth status as either present, missing, or a root tip, which is defined as a tooth with more than 95 percent of the anatomical crown either missing or decayed.
-
(2)
Radiolucencies on the tooth structure indicative of demineralization and/or dental caries.
-
(3)
The type and extent of dental restorations on an individual tooth including radiographic evidence of full and partial coverage crowns, fillings, root canals, and/or the presence of a dental implant in place of the tooth.
-
(4)
The percentage of the tooth’s coronal tooth structure that is decayed, missing and/or filled, calculated by the Overjet platform as the Decayed, Missing, and/or Filled Proportion (DMFP).
-
(5)
Interproximal alveolar bone levels (ABL) measured in millimeters from the cemento-enamel junction (CEJ) to the most apical crest of the interproximal alveolar bone, as an indicator of the tooth’s periodontal status.
-
(6)
Interproximal calculus on cementum for each tooth on both bitewing and periapical radiographs, scored as either absent or present.
-
(7)
Periapical Radiolucencies (PARL) on periapical radiographs that may or may not be associated with an endodontic root filling. PARL is scored as either absent or present.
-
(8)
Margin discrepancy (MD) where a full or partial coverage crown or filling has a defective margin, an over contoured or under contoured restoration, or an overhang where a restorative material extends beyond or over the margin apically. MD is scored as either absent or present. Note that this feature of the Overjet AI platform is not currently FDA cleared but was included in the analysis because it adds information about the quality of existing restorations.
AI model performance and training process
As part of the data cleaning and preprocessing pipeline, all patient and clinic data extracted from practice management systems (PMS) were assigned unique identifiers to prevent cross-association of information. Radiographs were matched to appointment dates, and any radiographs lacking an associated appointment date, as well as patients without documented age, were excluded from the dataset. Additionally, data related to proposed dental treatment plans or delivered treatments were linked to the corresponding patient and appointment using unique identifiers to ensure data consistency and integrity across clinical records. These steps were implemented to ensure that only accurate, complete, and temporally consistent data were used in developing and validating the OS-B score.
The AI models utilized in this study were originally developed and trained for clinical applications, using a robust dataset that reflected diversity across key variables such as patient demographics, image quality, and sensor types. Radiographs were annotated by calibrated dentists trained through a standardized internal process. While the models were not trained specifically for this research, they were applied here in the context of oral health quantification, demonstrating adaptability to new use cases beyond their original clinical deployment.
We implemented a methodical data partitioning strategy, creating separate training and test sets with the test set comprising tens of thousands of radiographs. Both datasets maintained balanced distributions across demographic and imaging characteristics. To ensure unbiased performance evaluation, we enforced strict patient-level separation between training and test sets, preventing any single patient’s data from appearing in both.
Our development follows a continuous improvement methodology based on real-world performance feedback. We systematically monitor model performance in clinical deployment settings and analyze practitioner feedback to identify specific failure patterns or edge cases. This intelligence informs our dataset enrichment strategy, allowing us to augment both training and test datasets with representative examples of challenging scenarios. This feedback loop enables our models to progressively improve their generalization capabilities, particularly for clinically important but statistically underrepresented presentations.
Developing the dataset
For the purposes of this study, we used deidentified data from 2,558 dental practices, which were randomly divided into three categories: a training dataset (n = 1,808), a validation dataset (n = 254) and a test dataset (n = 496). The training dataset was further subdivided to calculate a treatment probability-weighted cost-function for four clinical conditions:
-
(1)
Dental caries on teeth without crowns;
-
(2)
Recurrent dental caries on teeth with crowns;
-
(3)
Alveolar bone level and periodontal probing depth; and
-
(4)
Periapical radiolucency.
For each patient in the training dataset, we included clinical findings from their most recent dental radiographs, along with treatments provided in the 12 months following the latest radiographs as documented in the patient record using CDT codes. The average cost associated with each CDT code was calculated across all clinics. Additionally, probing depth (PD) measurements for each tooth were extracted from the patient records, with the maximum probing depth per tooth serving as an indicator of periodontal status.
Each data subset was constructed by applying filtering criteria. Initially, Overjet’s MLA determined the teeth as positive for specific findings and negative for others. Subsequently, the teeth were required to have received a specified set of treatments within one year of detecting a clinical finding being detected on a radiograph, as documented by CDT codes extracted from the patient records. Any treatments provided outside the primary dental practice were not available for inclusion in the dataset.
Table 3 provides an overview of the patient count, tooth count, along with the inclusion and exclusion criteria for the overall training dataset and subsets. For example, the caries subset includes teeth identified by Overjet’s MLA as positive for caries and negative for other clinical findings, such as margin discrepancies, calculus, root tips, bone levels exceeding 2.0 mm, PARL, implants, crowns, root tips, and bridges. Additionally, each tooth was required to have received treatment – such as a filling, crown, root canal therapy (RCT), extraction, or implant – within one year from the time of detection, as indicated by CDT codes in the patient’s electronic record, to remain in the dataset. These filtering criteria ensured that teeth included in each dataset were treated primarily due to conditions detected by Overjet AI.
The inclusion and exclusion criteria in Table 3 were designed to isolate the impact of each clinical condition on treatment decisions. For each condition, criteria were selected to ensure that the treatment received was most likely attributable to that specific finding, minimizing confounding effects from co-occurring conditions. For example, in the caries subset, teeth with other significant findings—such as PARL, crowns, implants, RCTs, bridges, or alveolar bone levels greater than 2 mm—were excluded to ensure that the treatment was primarily due to caries alone. Similarly, for the PARL subset, teeth were included only if they were positive for PARL and free from other overlapping conditions that could independently influence treatment. This approach was the most effective way to reduce confounding effects when attributing treatment patterns and costs to individual clinical findings.
Table 4 summarizes patient age and gender distribution across the overall training dataset and within each data subset for the four specific clinical conditions. Patients within the caries subset were slightly younger than those in the overall training dataset. In contrast, patients with the remaining clinical conditions were older, on average, which aligns with the increased prevalence of these conditions with advancing age.
Development of a “treatment probability weighted cost-function” to calculate the OS-B tooth scores
This research uses multiple data inputs to derive a novel treatment probability-weighted cost function for determining an individual tooth score. Using tooth-specific treatments administered within 12 months after the dental radiographs and the tooth’s state as calculated by Overjet’s MLA, we developed a function to estimate treatment costs based on the tooth’s clinical condition. The tooth score is based on the treatment cost needed to restore the tooth. The scoring acknowledges that dental restorations cannot perfectly replicate original tooth health. Higher treatment costs correspond to a lower tooth score, and lower costs correspond to a higher score. Once the individual tooth scores are calculated, the patient’s OS-B is determined by averaging the tooth scores of 28 individual teeth, excluding third molars.
The treatment probability-weighted cost function integrates both the likelihood and cost of various dental treatments indicated for specific clinical conditions. The clinical state of the tooth determines a distribution of possible treatments. The estimated treatment cost is calculated by multiplying the cost of each treatment by its associated probability. Finally, this expected treatment cost is used to adjust the tooth’s health score by subtracting the weighted cost from the base score of 100 (representing a healthy tooth).
A score of 100 is assigned to a healthy tooth that exhibits no restorations or pathology. As clinical findings are detected, the score decreases accordingly. For example, a tooth exhibiting initial caries or radiolucent areas of demineralization would have a higher score than a tooth with more extensive caries requiring more invasive and expensive treatment. Conversely, a tooth with extensive caries is assigned a lower score due to the likelihood of needing a multi-surface or full coverage restoration to return it to a state of health.
To illustrate how a tooth is scored using the treatment probability-weighted cost-function, we initially focused on the caries data subset, employing the DMFP as a metric for coronal caries severity. Within our training dataset, caries emerged as the most common clinical finding, affecting 85.2% of patients and 67.3% of teeth.
Figure 4A and B plot the probability of treatment and treatment cost against the DMFP value of a tooth with caries, respectively, and Fig. 4C plots tooth score as a function of DMFP. At low DMFP, the treatment cost is relatively low because only a small proportion of coronal tooth structure is compromised by demineralization or caries and a dental restoration or filling is the most performed treatment. As the DMFP increases treatment cost increases, as a larger portion of the tooth is compromised, necessitating more extensive interventions such as crowns, root canals, or extraction and placement of implants. These treatments are more invasive and expensive, leading to higher overall treatment costs.

(A) Treatment distribution across DMFP values. The red line represents the probability of receiving a filling, which steadily declines as DMFP increases. As the DMFP value increases, the likelihood of more extensive treatments increases; the orange line shows the probability of crown placement, which peaks at a DMFP value of approximately 0.68 before declining. The green line indicates the probability of root canal therapy (RCT), which rises with DMFP. The blue line represents the combined probability of extraction or implant placement, which increases sharply with higher DMFP scores. These trends mirror clinical practice, where increasing structural damage drives a shift toward more invasive and costly interventions. The error bars in this panel illustrate the 95% confidence intervals of the computed probabilities.(B) Treatment cost as a function of DMFP. This plot illustrates how treatment costs escalate with increasing DMFP. The red line depicts the average observed cost of treatment within 12 months following the assessment, which increases with rising DMFP values, reflecting the need for more extensive and expensive procedures as disease severity worsens. The green line represents a second-degree polynomial approximation of cost, which closely aligns with the observed trend, validating the reliability of the prediction. (C) Tooth score and caries-related deductions across DMFP values. This panel displays how the OS-B score for a tooth is calculated based on its DMFP. The blue line shows the resulting tooth score, which declines from 100 to 0 as DMFP increases from 0 to 1. In contrast, the green line shows the number of points deducted due to caries, which rises proportionally with DMFP. The deduction is derived by linearly scaling the cost function in (B), such that no points are deducted when DMFP is 0 and the maximum 100-point deduction is applied when DMFP is 1. The opposing trajectories of the two lines highlight the scoring logic and the increasing impact of carious damage.
Treatment patterns in Fig. 4A reflect clinical treatment distributions based on DMFP values. When DMFP is low—indicating minimal damage to tooth structure—fillings are the predominant treatment choice, allowing for conservative management of demineralized and carious tooth structure. As DMFP increases, showing greater structural compromise of the coronal tooth structure, treatments shift toward more extensive options like crowns, root canal therapy (RCT), or extractions with implant placement. This progression mirrors clinical practice, where severely damaged teeth require more extensive rehabilitation.
DMFP, while a valuable indicator of structural damage, is just one factor considered when making clinical treatment decisions. Clinical care is also influenced by dentist preferences, patient choices, symptoms, overall health, medical history, insurance coverage, and socioeconomic factors. For example, a patient with a high-DMFP tooth might choose extraction over a crown, RCT, or implant due to cost concerns, limited insurance, or access barriers to more complex and often more expensive treatment. This likely explains the sharp increase in extraction probability at higher DMFP values. While these external factors introduce variability in treatment selection, particularly in moderate to severe cases, the overall treatment trends consistently reflect how damage of the coronal tooth structure guides clinical decision-making in dental practice.
Figure 4B illustrates the relationship between a tooth’s DMFP and its treatment cost for the next 12 months. We approximate this relationship using a second-degree polynomial of the form (green curve in Figure 4B).
$$Cost = a*DMFP + b*DMFP^2$$
Values of a and b are obtained using the least squares regression algorithm. The tooth score is calculated by subtracting points from 100, with the deduction proportional to treatment costs over the next 12 months. This is mathematically realized by linearly scaling the polynomial via the following 2 constraints: no points are deducted when the DMFP is 0, and 100 points are deducted when the DMFP = 1.
Figure 5A illustrates the variation in treatment costs as a function of DMFP. At lower DMFP values, indicating less compromised coronal tooth structure, fillings are the most common treatment, with costs ranging from $200 to $600. As DMFP increases, the likelihood of full-coverage restorations (crowns) and extractions followed by dental implant placements, also increases, resulting in higher associated costs, as shown in Figure 5B. Consequently, the cost distribution shifts upward, and for DMFP values exceeding 0.8, extraction and implant placement become the most likely treatment, with typical costs ranging from $3000 to $4000.

(A) Treatment cost distribution as a function of DMFP in the caries dataset. At each DMFP interval, the minimum, maximum and mean costs are indicated by markers ( −) at the bottom, middle, and top of each vertical bar, respectively. The blue violin plots represent the density of treatment costs, indicating the intervals where treatment costs are most frequently observed. (B) Stacked bar chart showing treatment probabilities across the same DMFP intervals. As DMFP increases, the likelihood of more complex treatments (crown, RCT, extraction + implant) increases, while the probability of receiving a filling decreases.
A tooth’s score after restoration depends on two factors: the severity of the decay and compromised coronal tooth structure and the understanding that dental treatments cannot fully restore a tooth to perfect health. Our research estimates that restored teeth regain approximately 80% of their original health status.
The severity is measured by the tooth’s Average DMFP which is defined as
$$DMFP_average=\frac\sum _DMFP=0^1.0P(treatment P(treatment) $$
Here \(P(treatment | DMFP)\) denotes the probability of treatment for a given DMFP, derived from Fig. 5B. For example, the average DMFP for a crown treatment is 0.59. A tooth with this level of decay loses 50 points from its score. After crown placement, the tooth recovers 80% of these lost points, meaning only 10 points (20% of 50) are permanently deducted. This scoring system reflects that while restorative treatments significantly improve tooth function, they cannot achieve the same level of health as an original, undamaged tooth. Table 5 includes the determination of weightings for four types of restorations: 1) a full coverage restoration (crown); 2) a root canal treatment; 3) filling; and 4) an extraction and placement of a dental implant.
The number of points deducted for a filling depends on its size, with a minimum deduction of 4.6 points and a maximum of 10 points. Here we capped the point deductions for fillings to that of a crown treatment because filling treatments generally retain more original coronal tooth structure as compared to a crown.
To account for findings such as PARL and recurrent caries under crowns, we used a simple weighted average technique to determine point deductions. For each of these conditions we obtained the probability distribution of different treatment types, and used the DMFP-based point deduction for each of those treatments together with the probabilities as the weights, to find the average point deductions. Table 6 provides a summary of the treatment distributions and corresponding point deductions for PARL and recurrent caries under crown restorations, as represented by the following formula:
$$TS_condition= \sum\limits_t=1^nP(t)TS_t$$
where \(TS_condition\) represents either PARL or recurrent caries under crown, \(P(t)\) denotes the probability of a given treatment for the condition, and \(TS_t\) is the DMFP-based point deduction for the treatment performed for the condition.
Points are deducted when a tooth’s bone levels exceed 2.0 mm, where a measurement ≤ 2.0 mm is considered healthy. The deduction amount is proportional to the treatment cost at that bone level. Figures 6A and B illustrate the treatment probability and associated costs over the next 12 months as a function of a tooth’s bone level.

(A) Probability of various treatment types based on the bone level of teeth in the AL & PD dataset. The error bars in this panel illustrate the 95% confidence intervals of the computed probabilities. Advanced treatments may include procedures such as gingival flap surgery, osseous surgery, bone replacement grafts, and distal or proximal wedge procedures. (B) Relationship between treatment cost and bone level for the same set of teeth. The blue curve represents the estimated treatment costs, while the red line shows a first-degree polynomial approximation of cost. (C) Tooth Score vs. Bone Level. Tooth score decreases linearly as bone level exceeds 2.0 mm, with deductions scaled to treatment cost (B). At 6.71 mm, the average extraction threshold, 63.5 points are deducted. This scoring approach aligns with caries-based indices for consistent assessment of tooth health.
Following a methodology similar to that used in caries analysis, a first-degree polynomial is used to approximate the relationship between treatment cost and bone level of a tooth (red curve in Figure 6B):
The values of \(a\) and \(b\) are determined using the least squares regression algorithm. This first-order polynomial is then linearly scaled based on two constraints: no points are deducted when the bone level is less than or equal to 2.0 mm, and 63.5 points are deducted when the bone level reaches 6.71 mm. Similar to the Average DMFP, the Average Bone Level (\(BL\)) for extraction is 6.71 mm. We propose that the tooth score for a tooth requiring implant placement and restoration whether due to elevated bone levels or severe caries, should be equivalent. Figure 6C plots tooth score as a function of bone level.
Interproximal calculus on a tooth’s cementum typically requires scaling and root planing (SRP) treatment, with an associated cost equal to that of a tooth displaying a DMFP of 0.07, as seen in Figure 4B. According to the relationship between DMFP and tooth score (Figure 4C), 4.5 points are deducted from a score of 100 at this DMFP. Therefore, the presence of interproximal calculus results in a 4.5-point deduction. Similarly, a tooth typically requires SRP treatment when its probing depth exceeds 4 mm. Following the same point deduction approach as for interproximal calculus, 4.5 points are deducted when the probing depth surpasses 4 mm.
Point deductions due to Margin Discrepancy (MD) vary based on its type. If the margin discrepancy occurs on a filling, the deduction is based on the tooth’s DMFP. If the MD occurs on a crown, we assume that the tooth requires crown replacement, leading to a deduction of 50 points. A deduction of 100 points is applied when a tooth is missing or when only a root tip remains. Table 7 summarizes the point deductions for each clinical condition.
The previous sections explored how each of the eight clinical findings affects individual tooth scores. Each individual finding results in a specific number of points deducted from an ideal score of 100. When multiple findings are present, each deduction is calculated separately and then they are combined, as illustrated in Figure 7. The total deduction is subtracted from 100 to yield the final tooth score, while missing teeth and root tips are automatically assigned a score of zero.
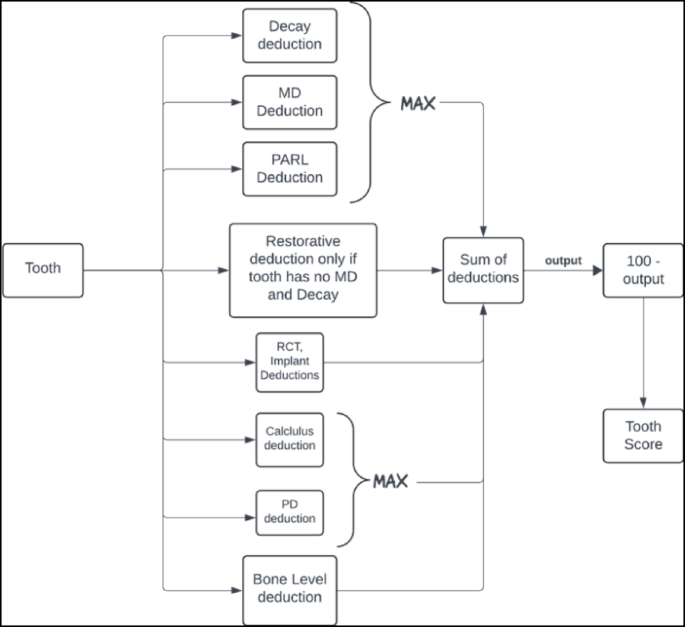
OS-B is calculated by first determining individual tooth scores, as shown in this figure, and then averaging these scores across the 28 permanent teeth, excluding third molars. Missing teeth and root tips are assigned a score of zero.
Since multiple conditions can often be addressed with a single restorative or endodontic procedure, treatment costs are non-additive. Thus, deductions for decay, MD, and PARL are combined by taking the maximum value among these findings. Similarly, deductions for elevated probing depth and interproximal calculus are also combined using the maximum value, as both conditions are typically treated together through SRP. Bone level deductions are treated independently from other findings, reflecting their distinct nature and specific treatment requirements. Restorative deductions (crowns and fillings) are only applied if there is no concurrent MD or decay, as restorations are automatically accounted for by the DMFP when these conditions are present. Figure 7 provides an illustration of the calculation process for individual tooth scores, while Figures 8 and 9 demonstrate the application of these calculations in patient cases.

Patient A’s original full-mouth X-rays (FMX) without AI predictions can be compared to the AI-analyzed FMX. Using AI predictions and the calculated oral score for each tooth, the odontogram provides individual tooth scores and an overall oral score. Patient A has an overall Oral Score of 65.5, impacted by findings including PARLs, bone levels, caries, calculus, MD, RCTs, and extensive restorative treatments.

Patient B’s original FMX and AI-analyzed FMX illustrate predications used to calculate each tooth’s Oral Score. The odontogram indicates an overall oral score of 98.7, primarily attributed to six restorations. This patient most likely has a prior history of dental decay that was successfully treated with dental restorations, restoring the patient’s health to an improved but not perfect OS-B of 98.7.
Example: Step-by-step calculation of individual tooth score
We provide the following example to illustrate how individual tooth scores are calculated using our methodology. Consider a tooth with the following clinical findings:
-
Moderate decay affecting 40% of the coronal area (DMFP = 0.4)
-
Radiographic interproximal bone level measurement of 4.0 mm
-
Periapical radiolucency (PARL)
-
Calculus present on the root surface
Step 1. Calculate individual condition deductions, approximated to one decimal place.
-
Caries deduction: DMFP of 0.4 results in 30.5 points deducted using the equation from Table 7: (60.4 × 0.4) + (39.6 × 0.42) = 24.2 + 6.3 = 30.5 points
-
Bone loss deduction: 4.0 mm bone level results in 27.4 points deducted: (13.7 × 4.0) − 27.3 = 54.8 − 27.3 = 27.5 points
-
PARL deduction: 63.3 points (fixed value from Table 7)
-
Calculus deduction: 4.5 points (fixed value from Table 7)
Step 2. Apply clinical prioritization rules As illustrated in Fig. 7, the scoring system applies clinical rules to avoid double-counting related conditions:
-
Decay vs. PARL: Use the maximum deduction (63.3 points for PARL > 30.5 points for caries)
-
Bone loss: Applied independently (27.5 points)
-
Calculus: Applied independently (4.5 points)
Step 3. Calculate final tooth score. Final calculation: 100 − (63.3 + 27.5 + 4.5) = 4.7
This tooth score of 4.7 out of 100 indicates the severely compromised condition of the tooth requiring extensive treatment.
link
More Stories
Dental Services Market: Cosmetic Dentistry Demand, Smile Makeovers & Market Forecast
In HelloNation, Dental Expert Dr. Mark Luvisotto of Windsor, ON, Explains Services Covered Under the Canadian Dental Care Plan
Press Release: Durbin Announces $3.5 Million Federal Funding for Parkland College Dental Education Program