


Publication search
After removal of duplicates, our initial Web of Science search returned 254 results. We then excluded 110 papers when restricting to publications made between \(1^\text st\) January 2014 and \(1^\text st\) May 2024. A further 63 papers were manually excluded that were published in journals outside of the scope of health research (as listed in Fig. 2). We were left with a total of 81 abstracts. This initial search step is illustrated in Fig. 5.
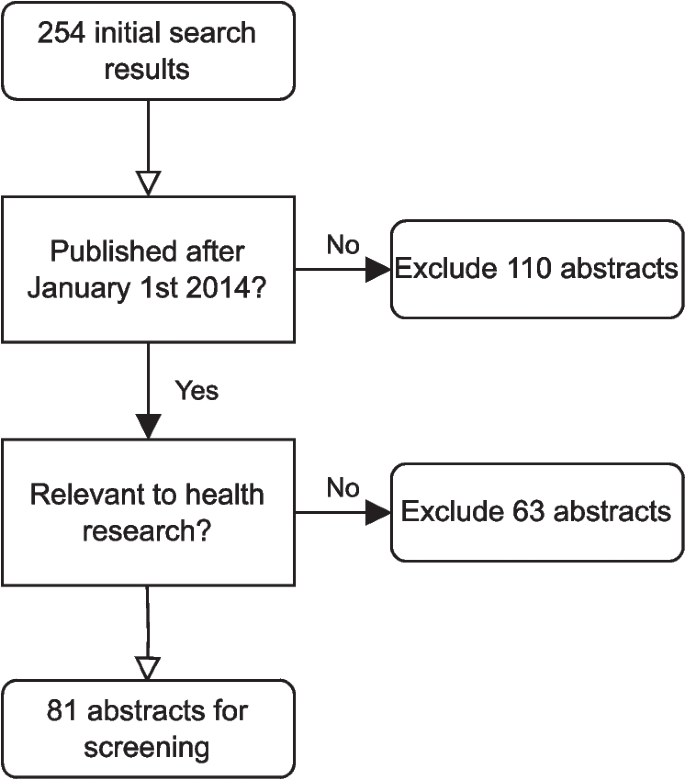
Flowchart of the publication search step of the review
We excluded 37 abstracts which did not provide a purpose-built statistical software implementation, 10 abstracts that did not focus on bias due to mismeasurement, and nine abstracts where the software provided was not conducting a QBA for mismeasurement (e.g., the QBA was instead for an alternative form of bias). The abstract screening process is illustrated in Fig. 6. When reviewing the full text of the remaining 25 articles, we found references to 24 unique software tools.
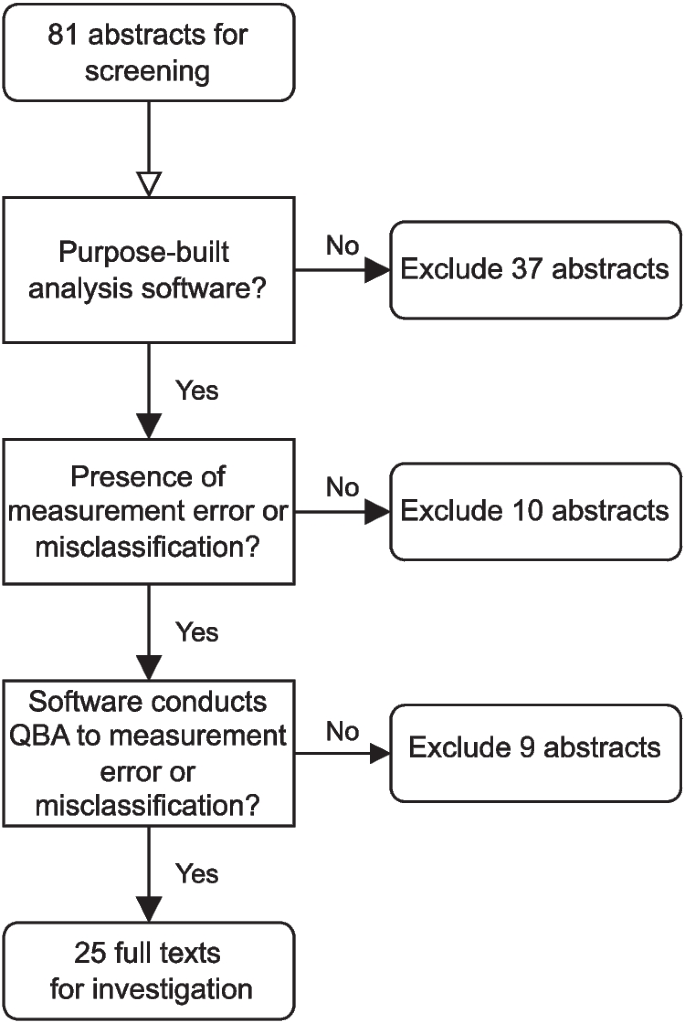
Flowchart of the abstract screening step of the review
Software repository search
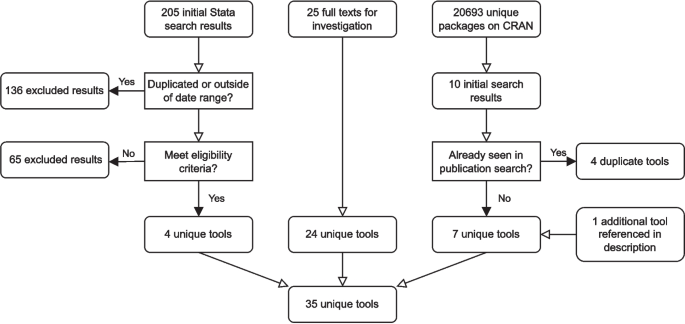
Our IDEAS search identified a single Stata command, episens [30, 31], however, the mismeasurement-related functions of this tool had not been updated since 2008, and so the tool fell outside of our date range for eligibility. We discuss this tool further in Grey literature section, and in Table 2.
Our CRAN search returned ten software tools, four of which had also been identified by our Web of Science search. The tool multibias [32] also referenced an additional web tool implementation in its documentation, multibias web tool [33]. Thus, in total, our CRAN search provided an additional seven tools.
Our search using the Stata search command returned an initial 205 results, 136 of which were either duplicates or were outside of our date range and so were excluded. From the 69 remaining search results, four eligible tools were found.
Eligibility criteria
In total, 35 unique software tools were identified across all of our searches, the process of which is summarised in Fig. 7. Among these 35 tools, nine were excluded because they did not implement a QBA to mismeasurement, four were excluded because they did not provide sufficient documentation or were code for a specific example requiring user adjustmentFootnote 3, one tool was excluded because it failed to run example code due to an unresolved runtime error at the time of review, and one tool was excluded because it had been removed from CRAN. The remaining 20 met our inclusion criteria.
Flowchart of the software tool search process
Of these 20 tools, web tool APScalculator [36], Stata command bamm [37], and R package SensiPhy [38] do not implement a QBA for an exposure effect estimate of an epidemiological study and so are excluded from the results presented in Table 1. The web tool APScalculator evaluates the impact of classical measurement error ([6], Chapter 1) on the categorization of a continuous variable into user-specified groups, rather than directly assessing bias in effect estimates. The R package SensiPhy estimates the impact of various sources of uncertainty in phylogenetic comparative methods used within ecology, which differs substantially from applications in health research. The Stata command bamm conducts a Bayesian bias analysis to investigate the distribution of a single misclassified categorical variable, which could be either nominal or ordinal.
Overview of included tools
Table 1 summarises the key features of the 17 total software programs we found that are applicable to health studies aiming to quantify bias in an effect estimate, in order of most recent update.
Environments and outputs
Of the tools reviewed, eight (47%) are implemented as R packages, six (35%) are web-based applications, and three (18%) are Stata commands.Footnote 4
Approximately half of the tools (eight) provide both graphical and tabular outputs to aid the researcher in interpreting the results. Only three tools do not produce tables: web tool SAMBA-EHR, web tool SensitivityAnalysis and R package ConMed. Three R packages and three Stata commands do not provide graphical plots of their results.
Mismeasurement
Of the 17 tools, four implement a QBA in the case of measurement error in a continuous variable (R packages miCoPTCM, ConMed and rcme, and web tool MediationSensitivityAnalysis). Only R package rcme allows for multiplicative measurement error (i.e., error that scales with the true value of the variable), whilst the rest of the tools employ a classical additive measurement error model ([6], Chapter 1). A total of 12 tools apply a QBA for misclassification of a binary variable. Only one tool, R package mgee2, implements a QBA when the misclassified variable has more than two categories.
In total, 11 software tools handle cases of outcome mismeasurement, 12 handle exposure mismeasurement, and seven handle mismeasurement in other covariates (such as effect modifiers, mediators, or potential confounders). Among these, two tools (web tools SAMBA-EHR and Outcome Misclassification) focus solely on outcome mismeasurement, four (Stata commands pvw and ivbounds, R package BayesSenMC, and multibias web tool) exclusively handle exposure mismeasurement, and only the web tool SensitivityAnalysis is specific to misclassification of a confounder.
Among the tools, nine are applicable for both differential and non-differential mismeasurement, while seven are for non-differential mismeasurement only. The R package EValue is specific to differential misclassification. Multiple variables can be mismeasured simultaneously in seven (41%) of the tools.
Bias analysis
A deterministic QBA is implemented exclusively in 11 tools, two (web tool SensitivityAnalysis and R package BayesSensMC) support only a probabilistic QBA, and three include options to implement both a deterministic and probabilistic QBA (R package episensr, web tool apisensr, and multibias web toolFootnote 5). Among the tools that implement a probabilistic QBA, only R package BayesSenMC performs a Bayesian bias analysis, and the remaining tools perform a Monte Carlo bias analysis. Among the tools that implement a deterministic QBA, only six (40%) perform a multidimensional analysis.
Multiple bias analysis
The Stata command biasepi, web tools MediationSensitivityAnalysis and multibias web tool, and the R packages EValue, ConMed, episensr, and multibias can all perform a multiple QBA for mismeasurement and unmeasured confounding. Additionally, Stata command biasepi, R package EValue, R package multibias, and multibias web tool can also adjust for selection bias. Note that all tools except R package EValue, R package episensr, and Stata command biasepi adjust for multiple sources of bias simultaneously; these tools instead apply a sequential approach.
Data requirements and analysis of interest
All tools except Stata command biasepi, which can take either individual or aggregate data as inputs, are specific in the data type required. Individual-level data is required by seven of the tools, aggregated count data by four tools, and summary statistics (such as regression coefficients or other statistics derived from the data) are required by six of the tools.
When the analysis of interest is a mediation analysis, two tools are applicable: web tool MediationSensitivityAnalysis and R package ConMed. The web tool MediationSensitivityAnalysis performs bias analysis for measurement error in the outcome, mediator, or other observed covariates (effect modifiers or potential confounders), with the assumption that the binary exposure is measured without error. The R package ConMed adjusts for measurement error in the mediator or outcome, and is applicable specifically when there is unmeasured confounding as well as measurement error.
For other types of analysis of interest, R package miCoPTCM accounts for measurement error of a continuous covariate or exposure in survival analysis (specifically a promotion time cure model), where the outcome is a time-to-event variable. Stata command ivbounds applies QBA for an instrumental variable analysis, allowing for a binary or categorical instrumental variable. R package mgee2 conducts QBA for a longitudinal analysis, where there are changes within the same individuals or groups over time. Of the remaining tools, five are applicable for the analysis of contingency tables and seven for logistic or linear regression.
Most tools require the outcome variable of the analysis of interest to be either binary (nine programs) or continuous (five programs). Only R package mgee2 and Stata command ivbounds allow for a discrete outcome variable with more than two categories. The exposure variable of the analysis of interest is typically required to be exclusively either binary (nine programs) or continuous (four programs), but two programs (web tool SAMBA-EHR and R package mgee2) allow exposure variables to be of multiple types including both discrete or continuous options. Of all of the tools, 12 (71%) allow for the inclusion of other covariates than just the exposure and outcome in the analysis.
Documentation and usability
Of the 17 tools reviewed, only two do not include usage examples, both of which are web tools. Documentation quality varies: eight tools have extensive documentation, six have moderate documentation, and three have minimal documentation. Ten tools fully implement a multidimensional or probabilistic QBA (i.e., user only requires essential QBA knowledge as the software implements all steps of the QBA including summaries of the results). However, seven tools require users to have specialist knowledge (e.g., a tool only performs a simple bias analysis and so a user must write their own code to conduct a probabilistic QBA using this tool).
Grey literature
In our formal search we focused on software described in the published literature between January \(1^\text st\) 2014 and May \(1^\text st\) 2024, or software made available during this period via CRAN, the Stata manuals, the IDEAS/RePEc database, or other Stata user-written commands available using Stata’s net command. This approach ensured we captured the latest tools which applied researchers could readily locate. However, we recognise that additional software exists that was not identified through this search. For example, some tools have not been mentioned in journal articles and are hosted in alternative environments such as web-based platforms. Others were developed before 2014 and have not been significantly updated since but remain in use. Table 2 gives a non-exhaustive brief overview of some tools known to the authors that were not captured by our formal search strategy, but that may be of interest to researchers.
Short code [34, 35], which consists of SAS and R code, is included in Table 2 despite having been initially captured in our formal search and later excluded based on our inclusion criteria; specifically, due to a lack of adequate documentation (see Eligibility criteria section). It is the only tool in Table 2 that passed initial screening stages but was actively excluded from the final review; the rest were not captured by our formal search. We include it here due to its prominence in the QBA literature and its potential value for learners, particularly when used alongside [13].
Another notable inclusion in Table 2 is the Misclassification spreadsheet Excel tool [75], which accompanies [13]. Although the spreadsheet was not captured by our formal search due to its distribution via a textbook website rather than publication or software repositories, we note that it has been widely disseminated (including, since this review was conducted, being directly linked in methodological guidance [76]). This spreadsheet remains a valuable and accessible tool for introducing researchers to the mechanics of QBA. Similarly, the episens command for Stata, originally released in 2008 [30], remains relatively widely used in the Stata community for QBA to exposure misclassification.
link
More Stories
Research Fellow in Health Services job with FLINDERS UNIVERSITY
Sunnybrook Health Sciences Centre Receives $10 Million Gift To Expand OCD Research, Education And Treatment
On Research: The importance of flexibility during times of crisis